

Optimize Microsoft 365 with Network Connectivity Tools
A frozen Teams call, a sluggish SharePoint upload, or a lagging Copilot response can derail productivity and frustrate users. As a Microsoft 365 admin, you’ve likely faced these issues and wondered, “Is it the network again?” Often, it is. Poor network performance can disrupt the M365 experience, but Microsoft offers powerful tools to diagnose and resolve these problems: the Network Connectivity report in the M365 Admin Center and the connectivity.microsoft.com portal. These tools act as your guide to identifying bottlenecks and optimizing performance for Teams, SharePoint, Exchange, and Copilot—no advanced networking degree required.
In this article, we’ll explore how to leverage these tools to enhance M365 performance across your organization. You’ll learn to pinpoint trouble spots, implement actionable fixes, and improve user satisfaction. Let’s dive in and transform your network into a performance powerhouse.
What’s the Network Connectivity Report Anyway?
The Network Connectivity report, found under the Health section of the M365 Admin Center, provides a comprehensive overview of how your network supports M365 services. It’s a dashboard of actionable insights, helping you avoid user complaints and streamline troubleshooting.
Key features include:
Performance score: A composite score (0–400) based on individual scores (0–100) for Copilot, SharePoint, Exchange, and Teams. Higher scores indicate better network health.
30-day trend: A graph tracking your score over the past month, revealing performance trends.
User distribution: A breakdown of remote versus onsite users, critical for hybrid work environments.
ISP overview: Details on Internet Service Providers (ISPs) handling your M365 traffic and their respective shares.
This report serves as your first step in diagnosing network issues, offering a clear starting point for optimization.
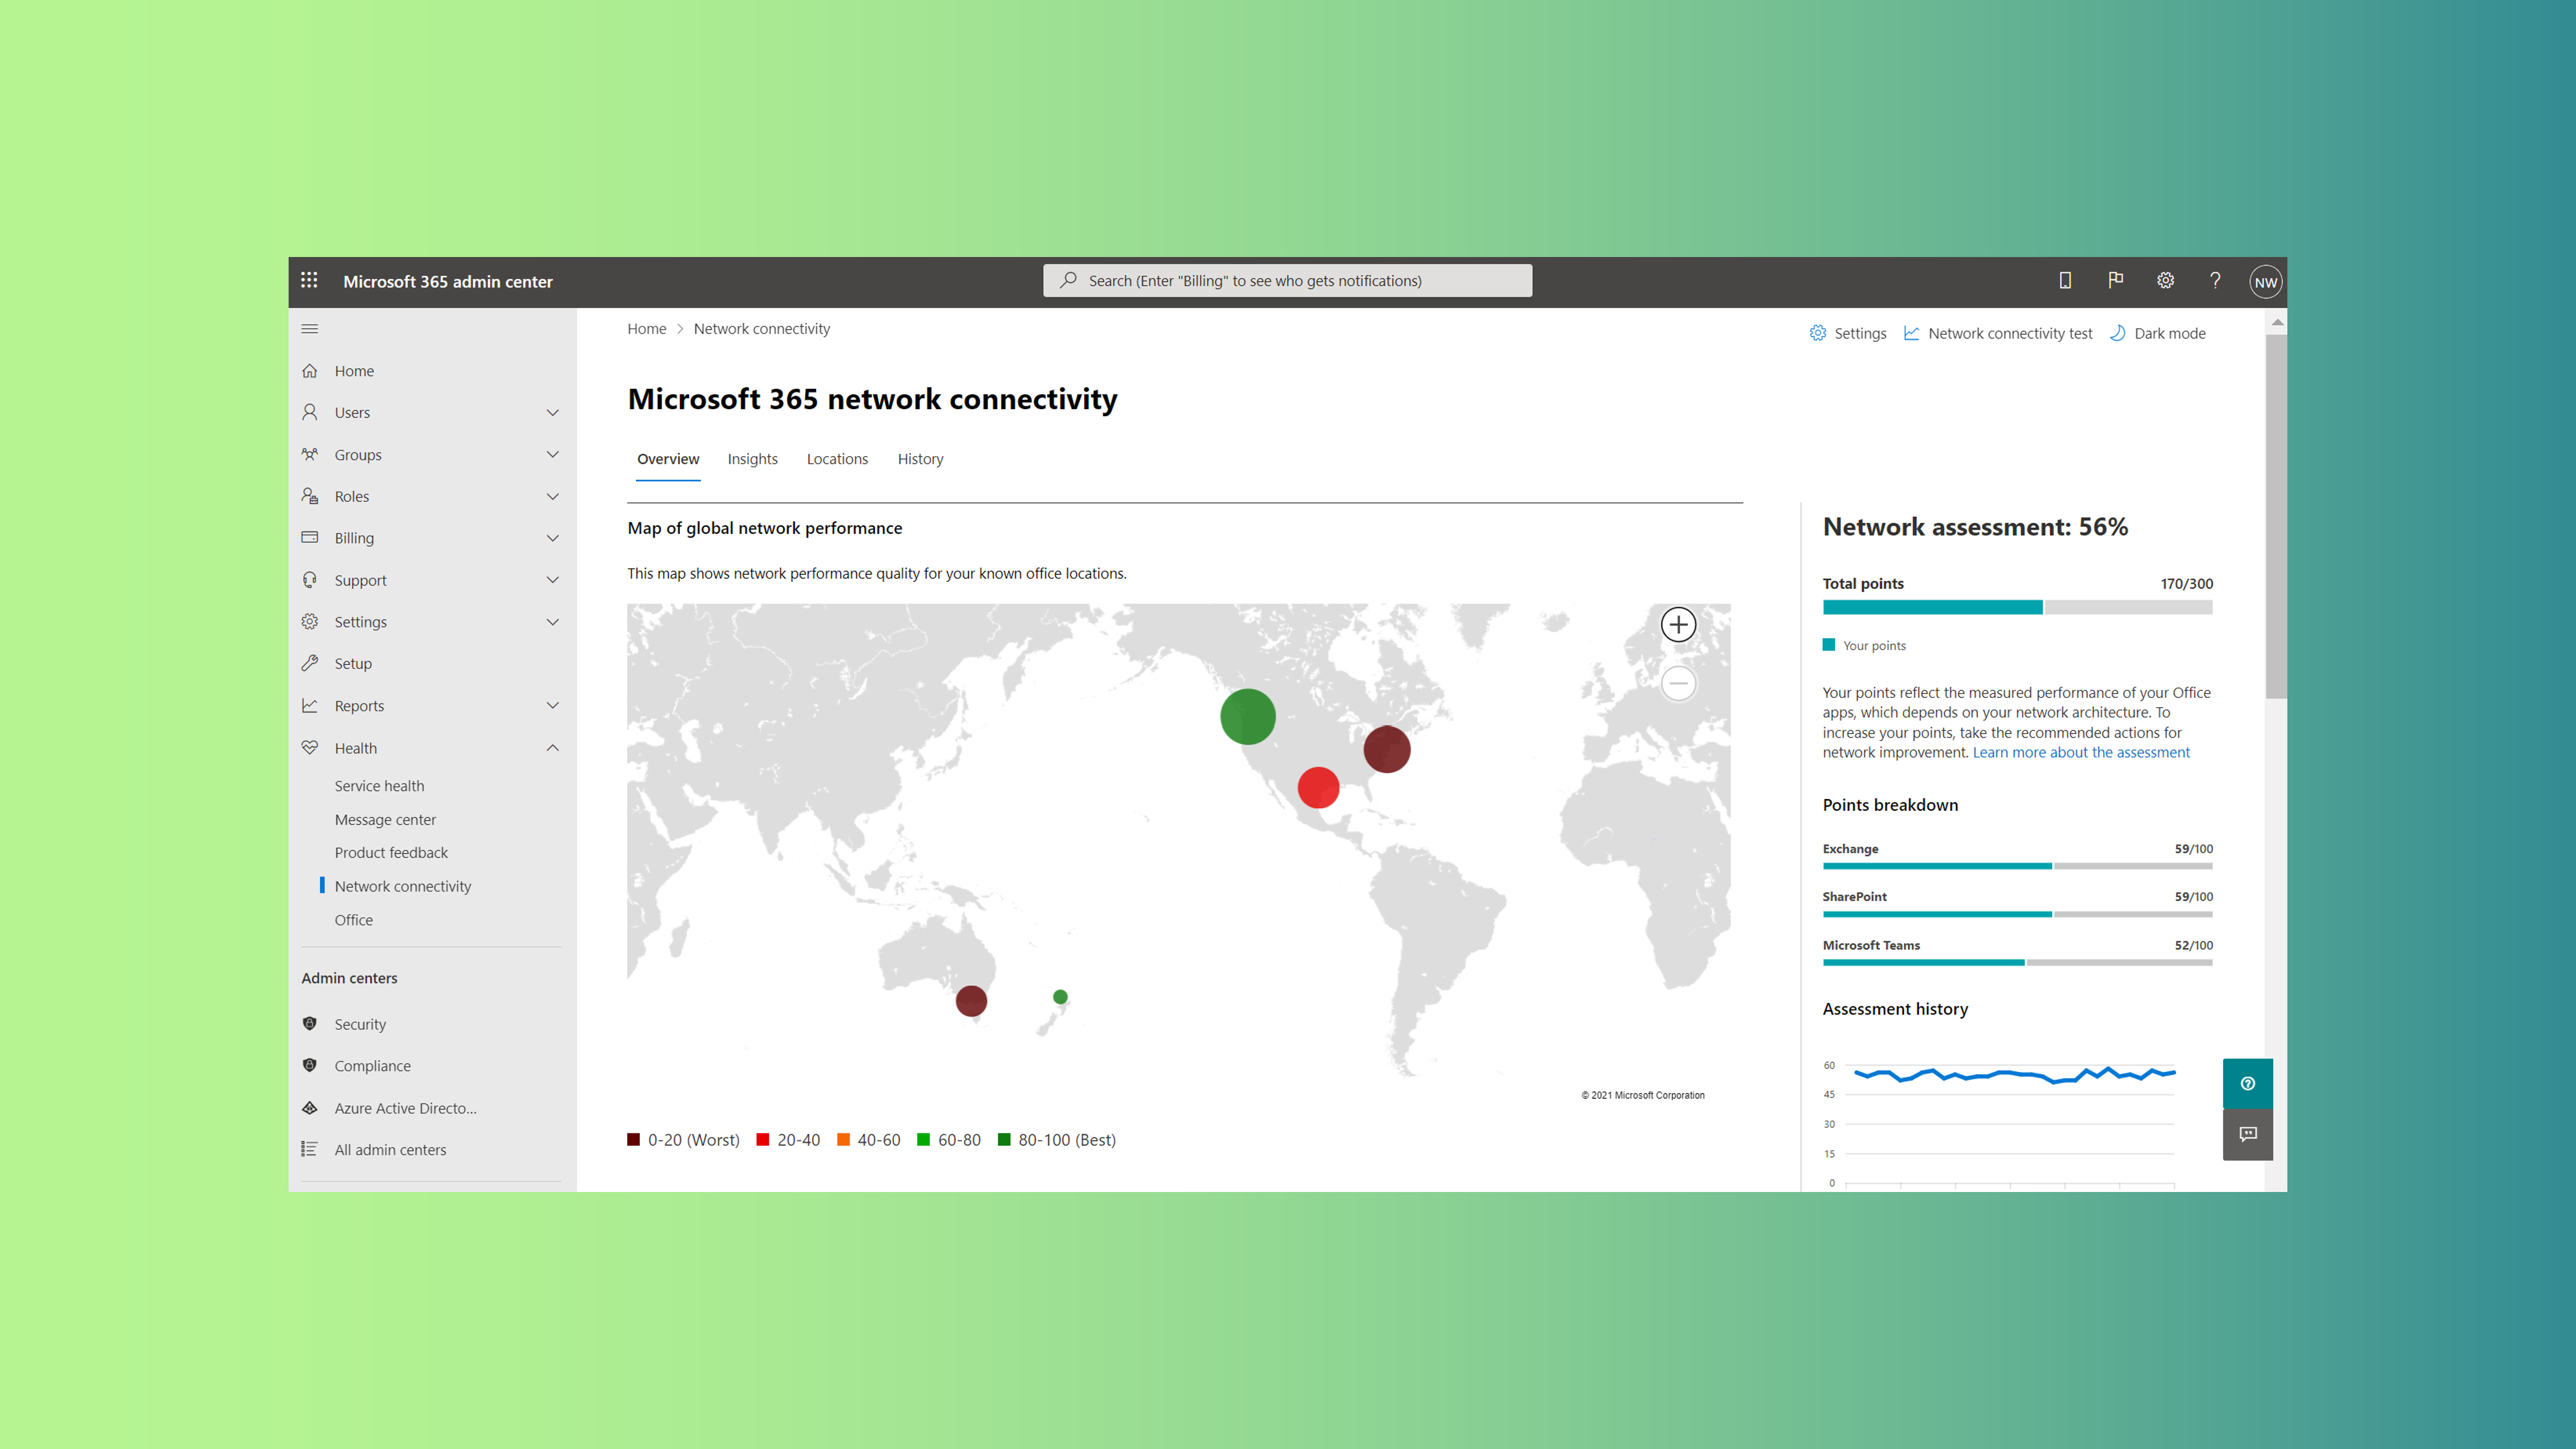
Exploring the Locations Map
The Locations map is a standout feature, visually displaying every location where users access M365, each marked with a performance score (0–100). It’s an intuitive tool for identifying underperforming areas.
How it works:
Score benchmarks: Scores of 80 or higher indicate strong performance; below 80 signals areas for improvement.
Interactive interface: Zoom in or out to view regions or offices, and click a location for detailed insights.
Prioritization: The map highlights where to focus efforts, such as addressing a low score in a key office.
For example, a low score in one office revealed a misconfigured proxy, which, once fixed, significantly improved performance and user experience.
Analyzing Location Details
Clicking a location on the map reveals in-depth metrics, pinpointing why performance excels or falters. Each location’s page includes:
User locations: Offices or remote sites accessing M365.
Internet egress point: The point where your traffic connects to the internet (e.g., NAT device or ISP).
Recommended connection points: Microsoft’s suggested “front doors” for optimal Exchange and SharePoint performance.
Performance metrics: Scores (0–100) for each application (SharePoint, Teams, Exchange) assessing latency, throughput, and more. Scores below 80 indicate issues to address.
The report also benchmarks your tenant’s performance against regional peers, providing context and motivation. Specific recommendations, such as adjusting DNS or bypassing proxies, ensure you have clear next steps.
Managing Network Traffic
The Network Traffic section details which ISPs handle your M365 data and their performance. This insight is crucial for identifying bottlenecks or unreliable providers.
Key insights:
ISP performance: See which ISPs carry the most traffic and how they perform for SharePoint, Exchange, and Teams.
Troubleshooting: If Teams calls lag on a specific ISP, you can investigate or reroute traffic.
Strategic decisions: Use data to negotiate with ISPs or optimize traffic routing.
One admin discovered a firewall, not the ISP, was causing slowdowns. This section helped identify the issue, saving time and preventing misdirected blame.
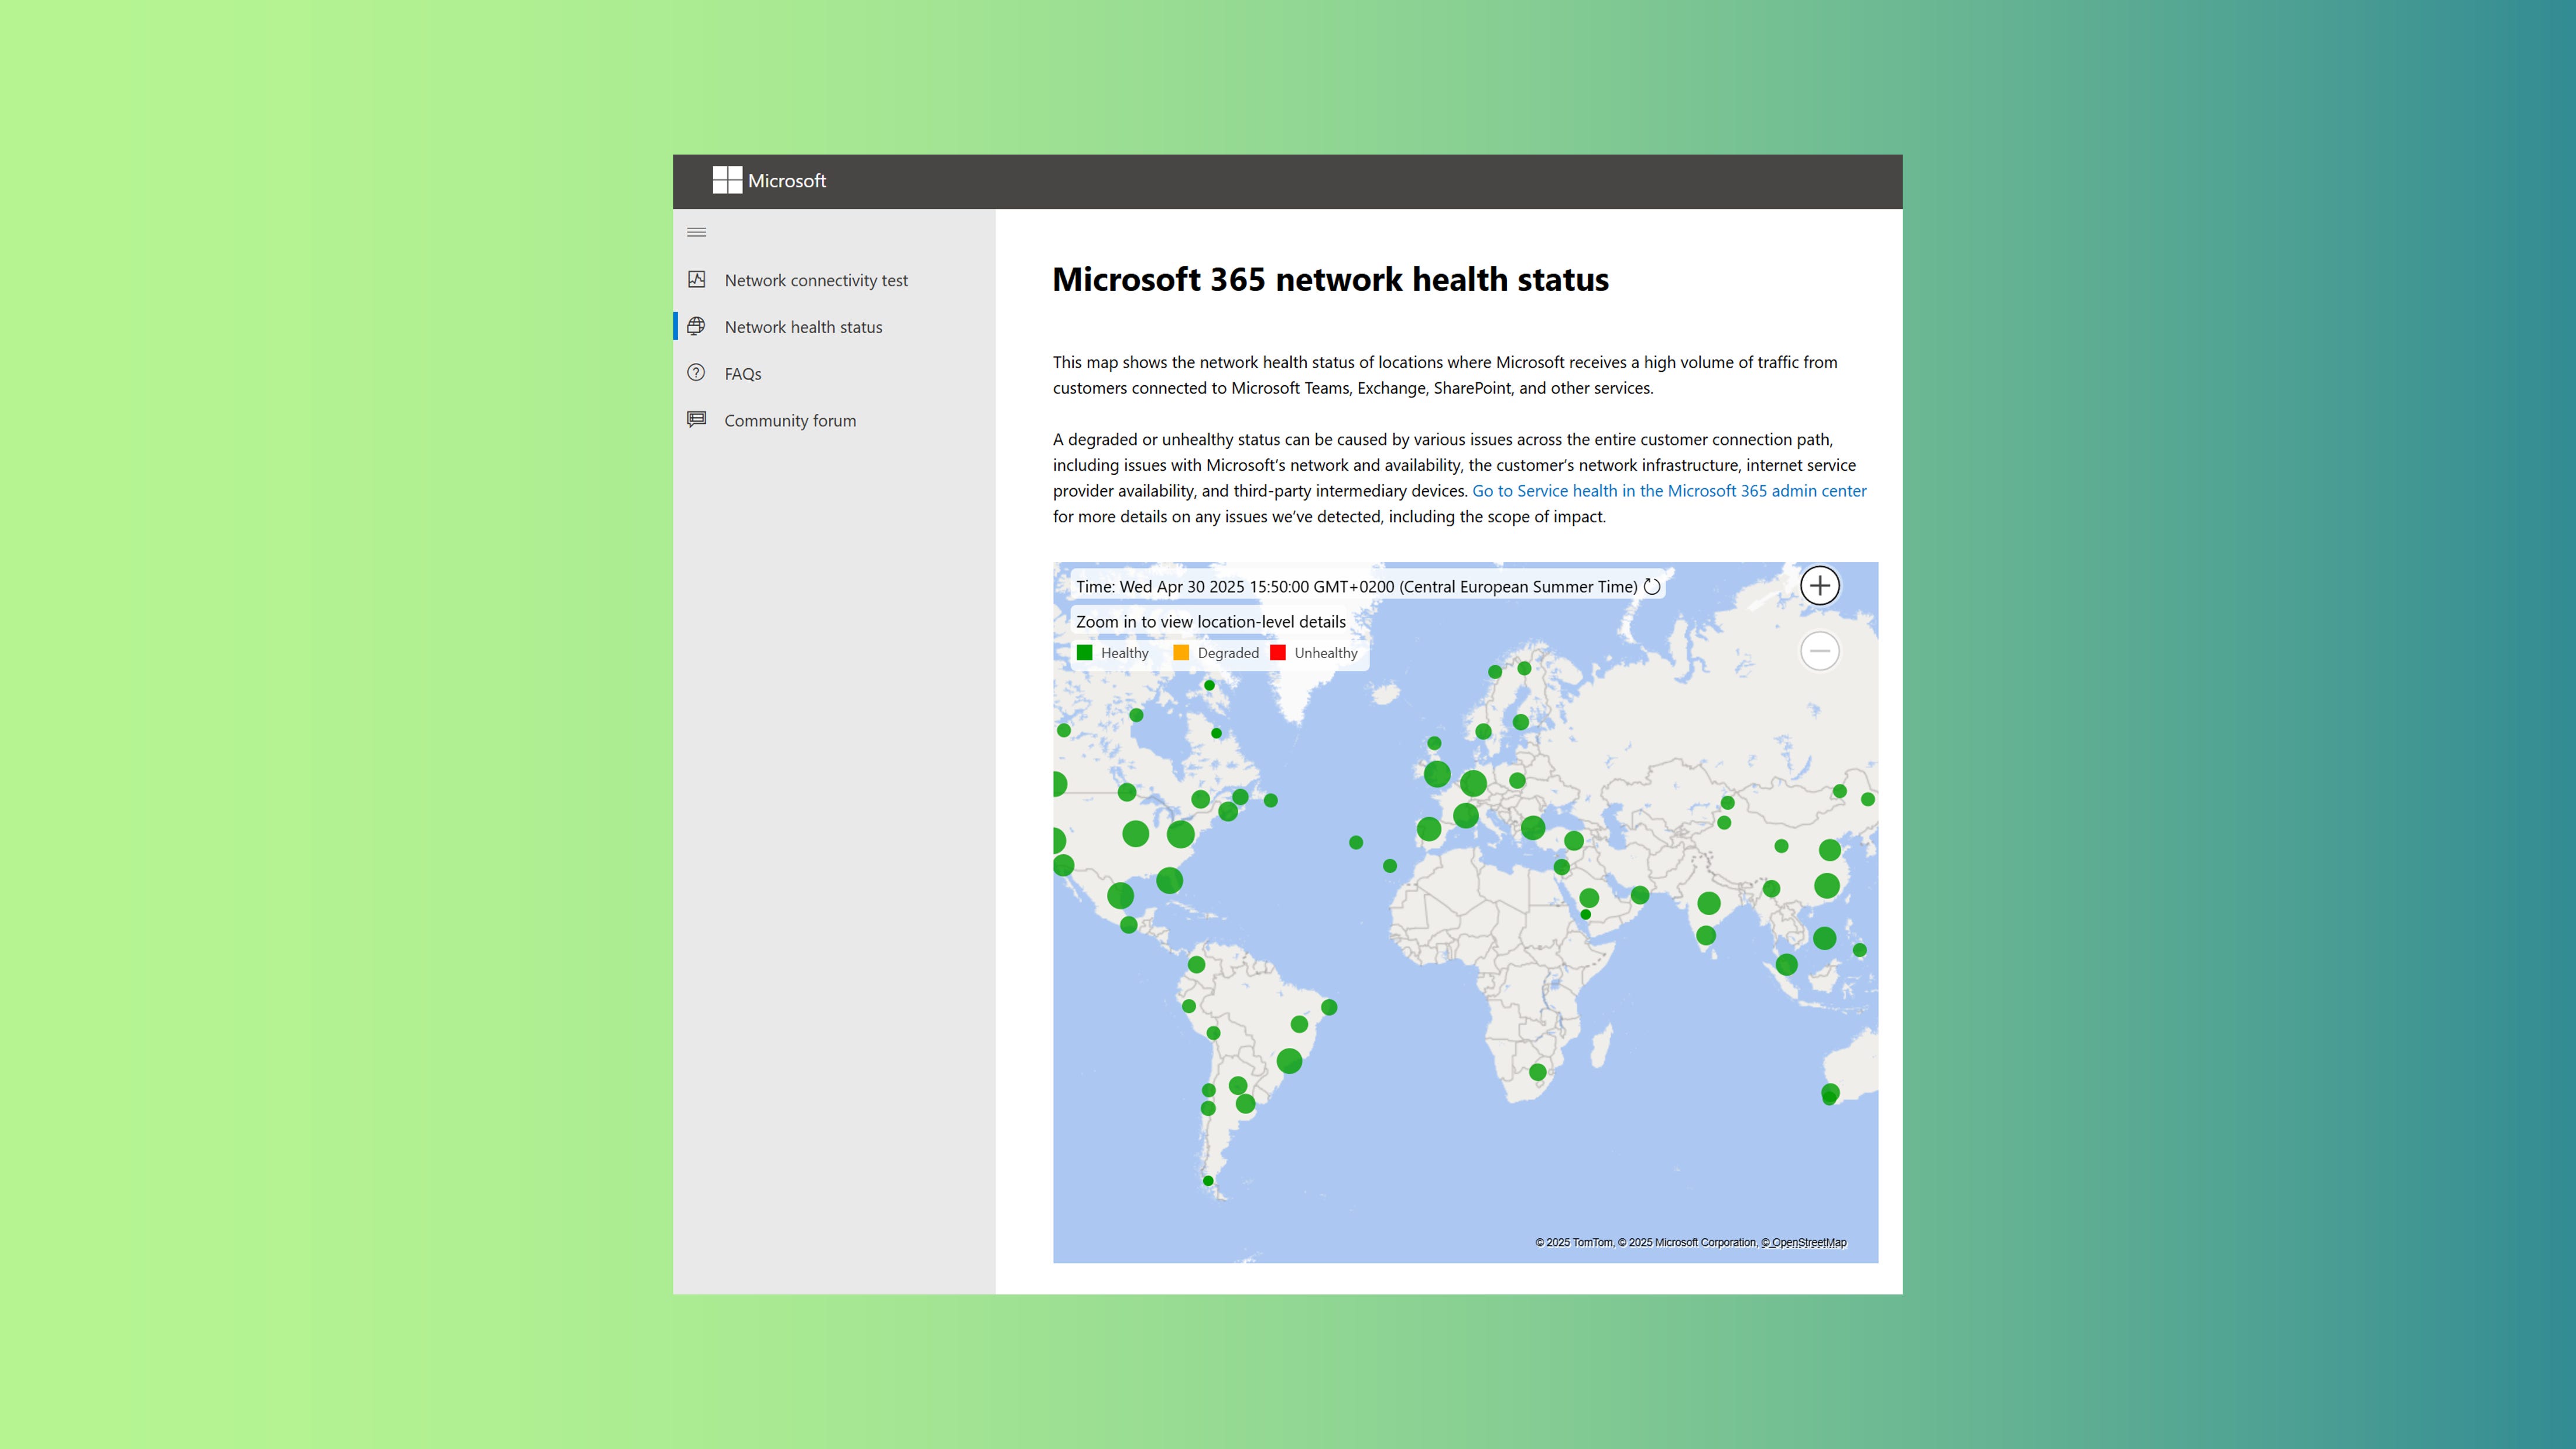
The connectivity.office.com Portal
The connectivity.office.com portal complements the Network Connectivity report by offering a global view of Microsoft’s network health and diagnostic tools for your environment.
Features include:
Network status: Confirm whether issues stem from Microsoft’s network or your own.
Diagnostic tests: Measure latency, WebSocket support, and more from specific locations, ideal for troubleshooting Copilot on mobile devices.
Actionable recommendations: Clear instructions, such as unblocking *.cloud.microsoft or fixing WebSocket configurations.
One test revealed a WebSocket issue affecting Copilot for remote users. Following the portal’s guidance resolved the problem, boosting performance and user satisfaction.
Conclusion
The Network Connectivity report and connectivity.microsoft.com empower M365 admins to diagnose and resolve network issues effectively. By identifying performance bottlenecks and implementing targeted fixes, you can ensure smooth Teams calls, fast SharePoint uploads, and responsive Copilot interactions. These tools transform complex network challenges into manageable tasks, making you a hero to your users.
Take action today: visit the M365 Admin Center to review your network scores and run diagnostics on connectivity.microsoft.com. Your users will appreciate the improved experience, and you might even earn some well-deserved recognition.
References
Microsoft 365 Network Connectivity Testing Tools:
Overview of Network Connectivity Principles:
Microsoft network connectivity for remote users:
Microsoft 365 network connectivity test tool: https://learn.microsoft.com/en-us/microsoft-365/enterprise/office-365-network-mac-perf-onboarding-tool?view=o365-worldwide
Network connectivity in the Microsoft 365 Admin Center: https://learn.microsoft.com/en-us/microsoft-365/enterprise/office-365-network-mac-perf-overview?view=o365-worldwide